
Free Agency Ratings (So Far)
Little math problem. I'll fix it soon.
EDIT: I have now switched these to being based on a much more accurate player rating, RAPM via http://stats-for-the-nba.appspot.com
I've made Free Agency ratings for each signing and team. These ratings are based on a few things:
First, Production ($). This refers to the estimated value of a player's Wins Above Replacement, which is based off my limited, but useful SPR rating. The basic math (which is somewhat based on the CBA) is roughly: $1.5 million x WARP + $1 million = Production $.
Some issues with this are:
1) A player's WARP will be diminished if they are injured
2) SPR ratings are not great at measuring defense
The latter I don't have a quick fix for. The former, I made a quick adjustment to. A player's initial value is multiplied up to 68*** games (i.e. if a player's production was $1 million and they played 34 games, their injury-adjusted production would be $2 million). If they played more than 68 games, they got full credit for that # of games played.
Here are the best deals so far, followed by each team's gained/lost value (measured by the "Difference" column in the first table).
*Please note that this does not include any player whose terms are not listed on Basketball Reference's free agency tracker (I know Manu, for example, isn't on here)*
***I used the Excel solver and asked it what standard # of games most accurately reflects money earned in the NBA. This was done by running the following math on each player-season:
2012 Raw Production $
-
(x / Games Played) * 2012 Raw Production $
=
Difference
Solver minimized this difference, and came up with about 68 games.
Fourteen Scorers Remain (Sort of)
Assuming that the final four teams in the NBA playoffs are Miami, Indiana, San Antonio, and Memphis, (a big assumption) there are only 14 players with at least 100 minutes played who are taking at least 20% of their team's true-shooting attempts.
Sorted by points per 48 in the playoffs (LeBron has probably been hurt here by slower play, Parker vice versa).
Sorted by points per 48 in the playoffs (LeBron has probably been hurt here by slower play, Parker vice versa).
| Player | Pos | Tm | TS% | SA% | Pts/48 | TS% - Avg |
|---|---|---|---|---|---|---|
| Tony Parker | PG | SAS | 54.0% | 30.5% | 23.4 | 0.5% |
| LeBron James | PF | MIA | 62.5% | 28.1% | 22.3 | 9.0% |
| Tim Duncan | C | SAS | 50.3% | 27.1% | 19.4 | -3.2% |
| Manu Ginobili | SG | SAS | 51.2% | 24.8% | 18.1 | -2.2% |
| Jerryd Bayless | PG | MEM | 50.3% | 24.3% | 17.1 | -3.2% |
| Zach Randolph | PF | MEM | 56.0% | 24.2% | 19.0 | 2.6% |
| Paul George | SF | IND | 51.5% | 23.3% | 16.1 | -1.9% |
| Mike Conley | PG | MEM | 53.2% | 22.8% | 16.9 | -0.2% |
| Dwyane Wade | SG | MIA | 47.4% | 22.6% | 13.6 | -6.1% |
| David West | PF | IND | 54.3% | 21.9% | 16.0 | 0.8% |
| Ray Allen | SG | MIA | 65.4% | 21.8% | 18.2 | 11.9% |
| Marc Gasol | C | MEM | 57.0% | 21.5% | 17.1 | 3.6% |
| George Hill | PG | IND | 55.5% | 21.3% | 15.8 | 2.0% |
| Chris Bosh | C | MIA | 56.8% | 20.6% | 14.9 | 3.3% |
Also, check out Miami...
| Player | Pos | Tm | TS% | SA% | Pts/48 | TS% - Avg |
|---|---|---|---|---|---|---|
| LeBron James | PF | MIA | 62.5% | 28.1% | 22.3 | 9.0% |
| Chris Andersen | C | MIA | 78.0% | 18.8% | 18.7 | 24.5% |
| Ray Allen | SG | MIA | 65.4% | 21.8% | 18.2 | 11.9% |
| Norris Cole | PG | MIA | 77.3% | 15.2% | 15.0 | 23.9% |
| Chris Bosh | C | MIA | 56.8% | 20.6% | 14.9 | 3.3% |
| Dwyane Wade | SG | MIA | 47.4% | 22.6% | 13.6 | -6.1% |
| Udonis Haslem | PF | MIA | 59.7% | 16.0% | 12.2 | 6.3% |
| Mario Chalmers | PG | MIA | 52.4% | 14.5% | 9.7 | -1.0% |
| Shane Battier | SF | MIA | 43.2% | 14.9% | 8.2 | -10.2% |
The Sweet 16 and Beyond
Here are the results of my latest 10,000 simulations of the tournament.
Notable Notes:
Expected number of double-digit seeds in the Sweet 16: 2.5
Odds of all four 1-seeds making it to the Sweet 16: 27%
Odds of La Salle making it to the Sweet 16: 37%
| reg | sd | s16 | e8 | f4 | title game | Champ | exp. Wins | |
|---|---|---|---|---|---|---|---|---|
| E | 1 | Indiana | 90% | 69% | 55% | 36% | 23% | 3.74 |
| S | 3 | Florida | 78% | 65% | 44% | 26% | 16% | 3.28 |
| W | 1 | Gonzaga | 78% | 63% | 41% | 25% | 14% | 3.20 |
| MW | 1 | Louisville | 67% | 52% | 34% | 20% | 10% | 2.83 |
| W | 2 | Ohio St. | 73% | 51% | 28% | 15% | 7% | 2.74 |
| S | 4 | Michigan | 69% | 42% | 22% | 11% | 6% | 2.50 |
| MW | 2 | Duke | 64% | 41% | 22% | 11% | 5% | 2.43 |
| E | 2 | Miami FL | 70% | 46% | 16% | 7% | 3% | 2.42 |
| W | 6 | Arizona | 82% | 33% | 13% | 5% | 1% | 2.34 |
| MW | 3 | Michigan St. | 68% | 31% | 14% | 6% | 2% | 2.21 |
| E | 4 | Syracuse | 76% | 24% | 13% | 5% | 2% | 2.21 |
| S | 7 | San Diego St. | 82% | 21% | 7% | 2% | 1% | 2.12 |
| S | 1 | Kansas | 58% | 27% | 12% | 5% | 2% | 2.05 |
| MW | 4 | St. Louis | 65% | 20% | 9% | 3% | 1% | 1.98 |
| E | 3 | Marquette | 58% | 25% | 7% | 2% | 1% | 1.92 |
| W | 12 | Mississippi | 63% | 18% | 7% | 2% | 1% | 1.92 |
| MW | 8 | Colorado St. | 33% | 20% | 10% | 4% | 2% | 1.69 |
| S | 8 | North Carolina | 42% | 17% | 6% | 2% | 1% | 1.68 |
| MW | 7 | Creighton | 36% | 19% | 8% | 3% | 1% | 1.68 |
| E | 6 | Butler | 42% | 15% | 3% | 1% | 0% | 1.62 |
| S | 5 | Virginia Commonwealth | 31% | 13% | 4% | 1% | 0% | 1.51 |
| E | 7 | Illinois | 30% | 13% | 3% | 1% | 0% | 1.47 |
| W | 10 | Iowa St. | 27% | 14% | 4% | 1% | 0% | 1.47 |
| W | 13 | La Salle | 37% | 7% | 2% | 0% | 0% | 1.46 |
| MW | 12 | Oregon | 35% | 7% | 2% | 0% | 0% | 1.45 |
| MW | 6 | Memphis | 32% | 9% | 2% | 1% | 0% | 1.43 |
| S | 11 | Minnesota | 22% | 13% | 5% | 1% | 0% | 1.42 |
| W | 9 | Wichita St. | 22% | 12% | 4% | 1% | 0% | 1.40 |
| E | 12 | California | 24% | 3% | 1% | 0% | 0% | 1.28 |
| W | 14 | Harvard | 18% | 3% | 0% | 0% | 0% | 1.21 |
| S | 15 | Florida Gulf Coast | 18% | 1% | 0% | 0% | 0% | 1.19 |
| E | 9 | Temple | 10% | 3% | 1% | 0% | 0% | 1.15 |
Simulated Tournament, Luck-Adjusted Style
Alright...so I did another 10,000 simulations, but I used a combination of my luck-adjustments and Ken Pomeroy's strength of schedule to come up with some decent results. Notably, turnovers (offensive and defensive) are far more important here.
| ro32 | s16 | e8 | f4 | title game | Champ | exp. Wins | ||
|---|---|---|---|---|---|---|---|---|
| 1 | Indiana | 100% | 85% | 68% | 58% | 38% | 26% | 3.74 |
| 2 | Florida | 99% | 81% | 64% | 43% | 24% | 15% | 3.26 |
| 3 | Louisville | 100% | 71% | 59% | 39% | 23% | 12% | 3.03 |
| 4 | Gonzaga | 100% | 67% | 49% | 33% | 21% | 11% | 2.81 |
| 5 | Ohio St. | 97% | 70% | 49% | 25% | 13% | 6% | 2.60 |
| 6 | Michigan | 92% | 73% | 48% | 25% | 13% | 7% | 2.58 |
| 7 | Duke | 99% | 69% | 46% | 24% | 12% | 5% | 2.55 |
| 8 | Miami FL | 95% | 67% | 47% | 15% | 6% | 2% | 2.32 |
| 9 | Syracuse | 96% | 72% | 21% | 13% | 5% | 2% | 2.09 |
| 10 | Kansas | 99% | 62% | 29% | 11% | 4% | 2% | 2.07 |
| 11 | Georgetown | 97% | 63% | 19% | 8% | 3% | 1% | 1.90 |
| 12 | Michigan St. | 84% | 56% | 26% | 11% | 5% | 2% | 1.83 |
| 13 | Wisconsin | 73% | 56% | 24% | 13% | 7% | 3% | 1.76 |
| 14 | New Mexico | 88% | 51% | 19% | 6% | 2% | 1% | 1.67 |
| 15 | Marquette | 71% | 46% | 21% | 5% | 1% | 0% | 1.44 |
| 16 | Arizona | 73% | 39% | 15% | 5% | 2% | 0% | 1.34 |
| 17 | Pittsburgh | 73% | 28% | 17% | 10% | 5% | 2% | 1.34 |
| 18 | St. Louis | 75% | 43% | 11% | 4% | 1% | 0% | 1.34 |
| 19 | North Carolina | 75% | 33% | 12% | 4% | 1% | 1% | 1.26 |
| 20 | Creighton | 65% | 23% | 12% | 5% | 2% | 1% | 1.08 |
| 21 | Oklahoma St. | 61% | 32% | 7% | 3% | 1% | 0% | 1.04 |
| 22 | North Carolina St. | 74% | 13% | 7% | 4% | 1% | 0% | 0.99 |
| 23 | Colorado St. | 57% | 18% | 13% | 7% | 3% | 1% | 0.99 |
| 24 | Virginia Commonwealth | 67% | 19% | 8% | 2% | 1% | 0% | 0.97 |
| 25 | Butler | 56% | 25% | 9% | 1% | 0% | 0% | 0.91 |
| 26 | San Diego St. | 57% | 23% | 5% | 1% | 0% | 0% | 0.87 |
| 27 | Kansas St. | 60% | 20% | 4% | 1% | 0% | 0% | 0.86 |
| 28 | Notre Dame | 54% | 17% | 9% | 3% | 1% | 0% | 0.83 |
| 29 | Nevada Las Vegas | 59% | 18% | 3% | 1% | 0% | 0% | 0.81 |
| 30 | Minnesota | 58% | 12% | 6% | 2% | 1% | 0% | 0.79 |
| 31 | Colorado | 51% | 16% | 8% | 1% | 0% | 0% | 0.77 |
| 32 | St. Mary's | 44% | 21% | 8% | 3% | 1% | 0% | 0.76 |
| 33 | Illinois | 49% | 15% | 7% | 1% | 0% | 0% | 0.73 |
| 34 | Iowa St. | 46% | 12% | 6% | 2% | 1% | 0% | 0.67 |
| 35 | Bucknell | 44% | 17% | 5% | 1% | 0% | 0% | 0.67 |
| 36 | Missouri | 43% | 11% | 6% | 3% | 1% | 0% | 0.64 |
| 37 | Memphis | 42% | 15% | 4% | 1% | 0% | 0% | 0.62 |
| 38 | Oklahoma | 43% | 14% | 2% | 1% | 0% | 0% | 0.60 |
| 39 | Oregon | 39% | 17% | 3% | 1% | 0% | 0% | 0.59 |
| 40 | UCLA | 42% | 7% | 3% | 1% | 0% | 0% | 0.54 |
| 41 | California | 41% | 10% | 1% | 0% | 0% | 0% | 0.51 |
| 42 | Cincinnati | 35% | 8% | 3% | 1% | 0% | 0% | 0.46 |
| 43 | Mississippi | 27% | 15% | 3% | 1% | 0% | 0% | 0.46 |
| 44 | Davidson | 29% | 13% | 3% | 0% | 0% | 0% | 0.46 |
| 45 | Akron | 33% | 6% | 1% | 0% | 0% | 0% | 0.41 |
| 46 | Belmont | 27% | 8% | 2% | 0% | 0% | 0% | 0.37 |
| 47 | Wichita St. | 27% | 5% | 2% | 1% | 0% | 0% | 0.35 |
| 48 | New Mexico St. | 25% | 8% | 1% | 0% | 0% | 0% | 0.34 |
| 49 | Villanova | 25% | 5% | 1% | 0% | 0% | 0% | 0.32 |
| 50 | Boise St. | 23% | 6% | 1% | 0% | 0% | 0% | 0.31 |
| 51 | Temple | 26% | 2% | 0% | 0% | 0% | 0% | 0.29 |
| 52 | Valparaiso | 16% | 5% | 1% | 0% | 0% | 0% | 0.22 |
| 53 | La Salle | 16% | 3% | 0% | 0% | 0% | 0% | 0.20 |
| 54 | Middle Tennessee | 14% | 4% | 1% | 0% | 0% | 0% | 0.19 |
| 55 | Harvard | 12% | 2% | 0% | 0% | 0% | 0% | 0.14 |
| 56 | South Dakota St. | 8% | 2% | 0% | 0% | 0% | 0% | 0.10 |
| 57 | Pacific | 5% | 1% | 0% | 0% | 0% | 0% | 0.06 |
| 58 | Montana | 4% | 1% | 0% | 0% | 0% | 0% | 0.04 |
| 59 | Florida Gulf Coast | 3% | 1% | 0% | 0% | 0% | 0% | 0.04 |
| 60 | Iona | 3% | 0% | 0% | 0% | 0% | 0% | 0.04 |
| 61 | Northwestern St. | 1% | 0% | 0% | 0% | 0% | 0% | 0.01 |
| 62 | Western Kentucky | 1% | 0% | 0% | 0% | 0% | 0% | 0.01 |
| 63 | Albany | 1% | 0% | 0% | 0% | 0% | 0% | 0.01 |
| 64 | Southern | 0% | 0% | 0% | 0% | 0% | 0% | 0.00 |
| 65 | Long Island | 0% | 0% | 0% | 0% | 0% | 0% | 0.00 |
| 66 | North Carolina A&T | 0% | 0% | 0% | 0% | 0% | 0% | 0.00 |
| 67 | Liberty | 0% | 0% | 0% | 0% | 0% | 0% | 0.00 |
Simulated Tournament, LRMC Style
I simulated the NCAA tournament 10,000 times based on the LRMC ratings. Just a pure-point-margin version of Ken Pomeroy's table. Use responsibly!
| ro32 | s16 | e8 | f4 | title game | champ | Exp. Wins | ||
|---|---|---|---|---|---|---|---|---|
| 1 | Indiana | 100% | 87% | 70% | 55% | 31% | 19% | 3.62 |
| 2 | Florida | 96% | 85% | 72% | 52% | 34% | 22% | 3.61 |
| 3 | Gonzaga | 100% | 78% | 63% | 48% | 31% | 18% | 3.37 |
| 4 | Louisville | 100% | 77% | 63% | 41% | 23% | 11% | 3.16 |
| 5 | Kansas | 99% | 83% | 53% | 24% | 12% | 6% | 2.77 |
| 6 | Miami (FL) | 95% | 73% | 54% | 21% | 8% | 3% | 2.55 |
| 7 | Ohio St. | 94% | 71% | 48% | 21% | 11% | 4% | 2.50 |
| 8 | Duke | 96% | 57% | 39% | 21% | 10% | 4% | 2.28 |
| 9 | Michigan | 87% | 60% | 30% | 11% | 5% | 2% | 1.95 |
| 10 | Syracuse | 90% | 62% | 19% | 10% | 3% | 1% | 1.85 |
| 11 | Georgetown | 90% | 56% | 14% | 5% | 2% | 1% | 1.67 |
| 12 | Creighton | 77% | 37% | 23% | 11% | 5% | 2% | 1.55 |
| 13 | Michigan St. | 79% | 45% | 18% | 7% | 3% | 1% | 1.52 |
| 14 | Wisconsin | 68% | 49% | 16% | 9% | 4% | 1% | 1.46 |
| 15 | New Mexico | 81% | 41% | 17% | 5% | 2% | 0% | 1.45 |
| 16 | Saint Louis | 73% | 38% | 10% | 3% | 1% | 0% | 1.26 |
| 17 | Oklahoma St. | 64% | 38% | 11% | 4% | 1% | 0% | 1.18 |
| 18 | Marquette | 56% | 33% | 13% | 3% | 1% | 0% | 1.05 |
| 19 | VCU | 65% | 27% | 9% | 3% | 1% | 0% | 1.05 |
| 20 | UNLV | 67% | 27% | 5% | 2% | 1% | 0% | 1.02 |
| 21 | Arizona | 53% | 30% | 12% | 3% | 1% | 0% | 1.01 |
| 22 | Bucknell | 58% | 26% | 9% | 2% | 0% | 0% | 0.95 |
| 23 | Kansas St. | 64% | 24% | 4% | 2% | 1% | 0% | 0.95 |
| 24 | Pittsburgh | 59% | 15% | 8% | 4% | 2% | 1% | 0.89 |
| 25 | San Diego St. | 57% | 25% | 5% | 1% | 0% | 0% | 0.88 |
| 26 | Iowa St. | 58% | 18% | 9% | 2% | 1% | 0% | 0.87 |
| 27 | N.C. State | 68% | 11% | 5% | 2% | 1% | 0% | 0.86 |
| 28 | Belmont | 47% | 25% | 9% | 2% | 1% | 0% | 0.84 |
| 29 | North Carolina | 64% | 13% | 4% | 1% | 0% | 0% | 0.81 |
| 30 | Davidson | 44% | 24% | 8% | 2% | 0% | 0% | 0.78 |
| 31 | Minnesota | 61% | 10% | 5% | 1% | 0% | 0% | 0.78 |
| 32 | Colorado | 53% | 15% | 7% | 1% | 0% | 0% | 0.76 |
| 33 | Colorado St. | 52% | 12% | 7% | 3% | 1% | 0% | 0.75 |
| 34 | Middle Tenn. St. | 35% | 20% | 8% | 3% | 1% | 0% | 0.68 |
| 35 | Missouri | 48% | 10% | 6% | 2% | 1% | 0% | 0.67 |
| 36 | Memphis | 40% | 17% | 5% | 1% | 0% | 0% | 0.64 |
| 37 | Butler | 42% | 16% | 4% | 1% | 0% | 0% | 0.64 |
| 38 | Illinois | 47% | 11% | 5% | 1% | 0% | 0% | 0.63 |
| 39 | Oklahoma | 43% | 16% | 2% | 1% | 0% | 0% | 0.62 |
| 40 | Notre Dame | 42% | 10% | 4% | 1% | 0% | 0% | 0.56 |
| 41 | Oregon | 36% | 16% | 3% | 1% | 0% | 0% | 0.55 |
| 42 | Wichita St. | 41% | 7% | 4% | 2% | 1% | 0% | 0.55 |
| 43 | Mississippi | 32% | 17% | 3% | 1% | 0% | 0% | 0.54 |
| 44 | Akron | 35% | 10% | 2% | 0% | 0% | 0% | 0.48 |
| 45 | UCLA | 39% | 4% | 2% | 0% | 0% | 0% | 0.46 |
| 46 | St. Mary's | 25% | 12% | 4% | 1% | 0% | 0% | 0.43 |
| 47 | California | 33% | 9% | 1% | 0% | 0% | 0% | 0.43 |
| 48 | Villanova | 36% | 4% | 1% | 0% | 0% | 0% | 0.42 |
| 49 | New Mexico St. | 27% | 8% | 1% | 0% | 0% | 0% | 0.36 |
| 50 | Temple | 32% | 2% | 1% | 0% | 0% | 0% | 0.35 |
| 51 | Cincinnati | 23% | 5% | 2% | 0% | 0% | 0% | 0.31 |
| 52 | Boise St. | 21% | 6% | 1% | 0% | 0% | 0% | 0.28 |
| 53 | Valparaiso | 21% | 6% | 1% | 0% | 0% | 0% | 0.28 |
| 54 | Harvard | 19% | 4% | 0% | 0% | 0% | 0% | 0.23 |
| 55 | La Salle | 15% | 4% | 0% | 0% | 0% | 0% | 0.19 |
| 56 | South Dakota St. | 13% | 3% | 0% | 0% | 0% | 0% | 0.17 |
| 57 | Fla Gulf Coast | 10% | 3% | 0% | 0% | 0% | 0% | 0.13 |
| 58 | Montana | 10% | 2% | 0% | 0% | 0% | 0% | 0.13 |
| 59 | Iona | 6% | 2% | 0% | 0% | 0% | 0% | 0.08 |
| 60 | Pacific | 5% | 1% | 0% | 0% | 0% | 0% | 0.06 |
| 61 | Northwestern St. | 4% | 1% | 0% | 0% | 0% | 0% | 0.05 |
| 62 | Albany | 4% | 1% | 0% | 0% | 0% | 0% | 0.04 |
| 63 | West. Kentucky | 1% | 0% | 0% | 0% | 0% | 0% | 0.01 |
| 64 | Southern | 0% | 0% | 0% | 0% | 0% | 0% | 0.00 |
| 65 | LIU Brooklyn | 0% | 0% | 0% | 0% | 0% | 0% | 0.00 |
| 66 | Liberty | 0% | 0% | 0% | 0% | 0% | 0% | 0.00 |
| 67 | N.C. A&T | 0% | 0% | 0% | 0% | 0% | 0% | 0.00 |
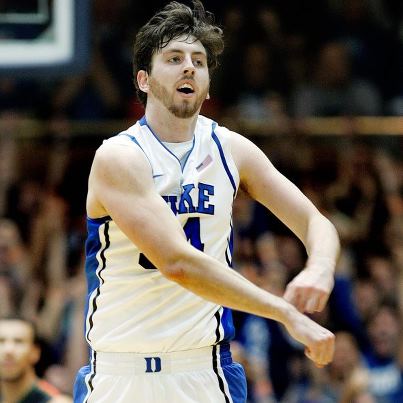
Exactly How Good Is R. Kelly?
 |
| YOU SEE ME RUNNIN' THROUGH THAT OPEN DOOOOR. |
You might remember last season that I tweeted LeHigh's praises in terms of their ability to possibly beat Duke, *even before the brackets came out*...but my statistics pushed LeHigh's odds way up when we learned that Kelly wouldn't make the LeHigh game...because in my system, he was definitely their best player.
I've heard a lot of claims from all sorts of people on how good R. Kelly is...the boys over at 99.9 The Fan (Raleigh represent...) seem to think that he has made Duke's defense impeccably better. I'm not so sure...but only because Ken Pomeroy mentioned that in a blog post.
By my SPR measure that estimates per-100-possession impact, he is the best player in the ACC (same as Daniel Myers' ASPM. But I am more interested in how much worse their defense got with him out. Let us investigate.
I looked at Duke's expected efficiency differential based on kenpom.com efficiency stats (and home-court advantage), versus how they actually played, and here's the difference we see:
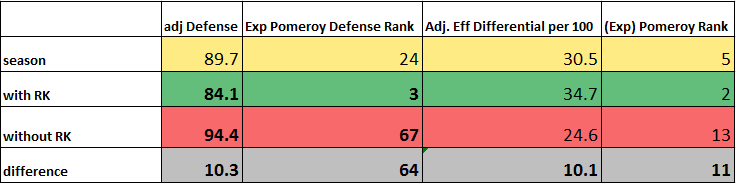
So despite Kelly's immense impact on offense, we can tell that at least Duke's defense looks better with him on the floor. Sixty-four places better.
All-Overrated and All-Underrated NBA Teams, 2013
All-Underrated Squad
Nate Robinson, PG
Andre Iguodala, SG
Thaddeus Young, SF
Nick Collison, PF
Kevin Garnett, C
All-Overrated Squad
Deron Williams, PG
JR Smith, SG
Klay Thompson, SF
Earl Clark, PF
Javale McGee, C
BOOM.
Players of the Month: December (so far)
Welcome, all! Here I will be grading players according to their estimated offensive and defensive impacts (using my per-100-possession stat, SimplePlayerRating) via Month-of-December-State. I'm rolling out my Defensive SPR here, finally. Formula at the bottom.
EDIT: Fixed the per-game numbers.
Surprises of the month go to: Andray Blatche (#6 #7), Paul George (#9 #10), Kemba Walker (#10 #11) and JJ Hickson (#17 #21!!!).
Without further ado, here are your top and bottom 26.
The Top 26
The Bottom 26
-The formula for DSPR is
DSPR = (1.3xSteals - 0.1xMissedFG + 0.2xDRB + 0.5xBLK)x100/Possessions Played - 3
-OSPR can be found here.
EDIT: Fixed the per-game numbers.
Surprises of the month go to: Andray Blatche (
Without further ado, here are your top and bottom 26.
The Top 26
| Player | Season | OSPR | DSPR | Total SPR | SPR per Game | |
|---|---|---|---|---|---|---|
| 1 | Carmelo Anthony | 2012-13 | 10.6 | -0.7 | 9.9 | 7.5 |
| 2 | LeBron James | 2012-13 | 6.9 | 1.3 | 8.1 | 6.5 |
| 3 | Blake Griffin | 2012-13 | 7.1 | 2.5 | 9.6 | 6.4 |
| 4 | Kevin Durant | 2012-13 | 6.2 | 0.4 | 6.6 | 5.4 |
| 5 | Chris Paul | 2012-13 | 6.3 | 2.1 | 8.4 | 5.4 |
| 6 | Kobe Bryant | 2012-13 | 6.4 | -0.5 | 5.9 | 5.0 |
| 7 | Andray Blatche | 2012-13 | 4.7 | 3.6 | 8.2 | 4.8 |
| 8 | Ryan Anderson | 2012-13 | 7.9 | -1.4 | 6.5 | 4.6 |
| 9 | Tony Parker | 2012-13 | 7.3 | -0.6 | 6.6 | 4.6 |
| 10 | Paul George | 2012-13 | 4.7 | 1.0 | 5.7 | 4.5 |
| 11 | Kemba Walker | 2012-13 | 6.4 | -0.1 | 6.3 | 4.4 |
| 12 | Chris Copeland | 2012-13 | 12.7 | 1.2 | 13.9 | 4.3 |
| 13 | Russell Westbrook | 2012-13 | 4.9 | 0.8 | 5.8 | 4.2 |
| 15 | Stephen Curry | 2012-13 | 5.0 | -0.3 | 4.7 | 3.9 |
| 16 | Paul Millsap | 2012-13 | 4.1 | 1.3 | 5.4 | 3.7 |
| 17 | James Harden | 2012-13 | 4.0 | 0.5 | 4.5 | 3.7 |
| 18 | Tyson Chandler | 2012-13 | 3.7 | 1.3 | 5.0 | 3.5 |
| 19 | Andrei Kirilenko | 2012-13 | 1.1 | 3.5 | 4.6 | 3.5 |
| 21 | J.J. Hickson | 2012-13 | 5.4 | 1.0 | 6.4 | 3.4 |
| 20 | Matt Barnes | 2012-13 | 4.5 | 1.9 | 6.4 | 3.4 |
| 22 | Ed Davis | 2012-13 | 4.4 | 2.4 | 6.8 | 3.4 |
| 23 | Dwyane Wade | 2012-13 | 5.3 | -0.4 | 4.8 | 3.2 |
| 24 | David Lee | 2012-13 | 3.8 | 0.2 | 4.0 | 3.2 |
| 27 | Kyrie Irving | 2012-13 | 5.9 | -1.6 | 4.3 | 3.2 |
| 26 | Eric Bledsoe | 2012-13 | 3.6 | 4.6 | 8.2 | 3.2 |
The Bottom 26
| Player | Season | OSPR | DSPR | Total SPR | SPR per Game | |
|---|---|---|---|---|---|---|
| 387 | Daniel Gibson | 2012-13 | -5.5 | -1.7 | -7.2 | -3.9 |
| 386 | Kyle Singler | 2012-13 | -4.1 | -1.8 | -5.9 | -3.8 |
| 388 | Doron Lamb | 2012-13 | -8.9 | -1.6 | -10.5 | -3.8 |
| 382 | Mickael Pietrus | 2012-13 | -4.6 | -1.1 | -5.7 | -3.5 |
| 383 | Andre Iguodala | 2012-13 | -5.3 | 0.7 | -4.6 | -3.4 |
| 379 | Chris Singleton | 2012-13 | -5.9 | 0.1 | -5.8 | -3.3 |
| 381 | J.R. Smith | 2012-13 | -3.6 | -1.5 | -5.1 | -3.3 |
| 378 | Andrea Bargnani | 2012-13 | -3.2 | -2.2 | -5.4 | -3.2 |
| 377 | Victor Claver | 2012-13 | -11.3 | 2.0 | -9.3 | -3.2 |
| 376 | Jeff Taylor | 2012-13 | -3.1 | -2.3 | -5.4 | -3.1 |
| 374 | Jerry Stackhouse | 2012-13 | -4.0 | -2.6 | -6.6 | -3.0 |
| 375 | Bismack Biyombo | 2012-13 | -5.0 | 0.5 | -4.5 | -3.0 |
| 372 | Alonzo Gee | 2012-13 | -3.3 | -0.8 | -4.1 | -3.0 |
| 373 | Gerald Green | 2012-13 | -4.7 | -1.9 | -6.7 | -2.9 |
| 370 | Willie Green | 2012-13 | -5.6 | -2.2 | -7.8 | -2.8 |
| 369 | Festus Ezeli | 2012-13 | -7.6 | -0.9 | -8.5 | -2.6 |
| 368 | Dahntay Jones | 2012-13 | -4.1 | -2.4 | -6.5 | -2.6 |
| 367 | Austin Rivers | 2012-13 | -2.6 | -1.7 | -4.3 | -2.6 |
| 365 | Keith Bogans | 2012-13 | -9.1 | -2.6 | -11.7 | -2.6 |
| 364 | Sebastian Telfair | 2012-13 | -3.2 | -2.4 | -5.6 | -2.4 |
| 363 | Aaron Brooks | 2012-13 | -2.7 | -1.6 | -4.3 | -2.4 |
| 361 | Martell Webster | 2012-13 | -2.8 | -1.0 | -3.8 | -2.4 |
| 362 | John Salmons | 2012-13 | -1.8 | -1.8 | -3.6 | -2.4 |
| 359 | Jason Maxiell | 2012-13 | -5.4 | 1.6 | -3.8 | -2.3 |
| 360 | Tony Allen | 2012-13 | -6.1 | 1.5 | -4.6 | -2.3 |
| 358 | Nolan Smith | 2012-13 | -6.5 | -2.8 | -9.3 | -2.3 |
DSPR = (1.3xSteals - 0.1xMissedFG + 0.2xDRB + 0.5xBLK)x100/Possessions Played - 3
-OSPR can be found here.