
 |
| "The Nation's Best Point Guard" apparently. |
 I did a very quick study on how conferences/teams are underrated or overrated in the polls.
First, I combined the ESPN and AP Polls from Monday.
Here's a simple formula based on regression to add the vote totals from both polls for NCAA basketball:
Total Adjusted Votes= AP votes + (2*ESPN Votes+26)
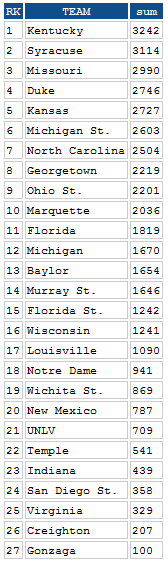
The top-27 in this method is shown left.
All teams worse than #27 were given a simple "#40" as a placeholder . I then compared each of these team's rankings to my own ranking system, which is very similar to Ken Pomeroy's...I can just fiddle with it as I please :). From this, it's pretty easy to see that teams that have won a lot of close games are overrated and vice versa (if you trust us stat-geeks on the principle of 'luck').
To convert Luck (Win% - Expected Win%) to ranking deviation (Poll rank - my rank), I found the following easy equation:
Expected Ranking Deviation = 140 * Luck% - 0.38
So for each conference, I found the average luck of my top 49 (I stopped at 49 because that's where Murray is ranked) and found the following. I split the rankings into three categories
-Murray State (the only OVC team here, and the most overrated team in the country)
-Conferences (with at least 2 listed teams in the poll)
-Other Conferences (the total of each of the conferences with one bid)
Like so:
| # | Top 40 Avg Luck | |
|---|---|---|
| Murray State | 1 | 0.138 |
| A10 | 2 | 0.016 |
| WCC | 3 | 0.009 |
| MVC | 2 | 0.004 |
| Other Mid-Majors | 5 | -0.002 |
| BE | 9 | -0.002 |
| MWC | 2 | -0.007 |
| B12 | 6 | -0.012 |
| ACC | 5 | -0.014 |
| P12 | 2 | -0.033 |
| B10 | 6 | -0.040 |
| SEC | 4 | -0.048 |
Then I used the Expected Ranking Deviation formula to come up with each 'conference's average expected ranking deviation:
| # | ExpRkDiff | |
|---|---|---|
| Murray State | 1 | 18.9 |
| A10 | 2 | 1.9 |
| WCC | 3 | 0.9 |
| MVC | 2 | 0.1 |
| Other Mid-Majors | 5 | -0.7 |
| BE | 9 | -0.7 |
| MWC | 2 | -1.4 |
| B12 | 6 | -2.0 |
| ACC | 5 | -2.4 |
| P12 | 2 | -5.0 |
| B10 | 6 | -6.0 |
| SEC | 4 | -7.1 |
Then I simply subtracted each team's Expected Ranking Difference from their Actual Ranking Difference to give us an estimate of conference bias. The results are pretty intuitive:
| # | Top 40 Luck | ExpRkDiff | ActualRkDiff | Bias | |
|---|---|---|---|---|---|
| Murray State | 1 | 0.138 | 18.9 | 33.0 | 14.1 |
| B10 | 6 | -0.040 | -6.0 | -2.0 | 4.0 |
| BE | 9 | -0.002 | -0.7 | 3.0 | 3.7 |
| ACC | 5 | -0.014 | -2.4 | 1.2 | 3.6 |
| SEC | 4 | -0.048 | -7.1 | -7.0 | 0.1 |
| WCC | 3 | 0.009 | 0.9 | -0.7 | -1.6 |
| MVC | 2 | 0.004 | 0.1 | -1.5 | -1.6 |
| B12 | 6 | -0.012 | -2.0 | -4.3 | -2.3 |
| P12 | 2 | -0.033 | -5.0 | -8.0 | -3.0 |
| Other Mid-Majors | 5 | -0.002 | -0.7 | -5.4 | -4.7 |
| A10 | 2 | 0.016 | 1.9 | -6.5 | -8.4 |
| MWC | 2 | -0.007 | -1.4 | -12.0 | -10.6 |
The only real surprise to my eyes is the Big 12 having a bias of -2.3. Murray State is overrated by their ridiculously easy schedule which they haven't beaten to a pulp. The only four other overrateds are the rest of the power conferences minus the Pac-12, who is still in "recovery mode."
0 comments:
Post a Comment